Links
Problem A
Income Inequality
We often compute the average as the first step in processing statistical data. Yes, the average is a good tendency measure of data, but it is not always the best. In some cases, the average may hinder the understanding of the data.
For example, consider the national income of a country. As the term income inequality suggests, a small number of people earn a good portion of the gross national income in many countries. In such cases, the average income computes much higher than the income of the vast majority. It is not appropriate to regard the average as the income of typical people.
Let us observe the above-mentioned phenomenon in some concrete data. Incomes of n people, a1, … , an, are given. You are asked to write a program that reports the number of people whose incomes are less than or equal to the average (a1 + … + an) / n.
Input
The input consists of multiple datasets, each in the following format.
n
a1 a2 … an
A dataset consists of two lines. In the first line, the number of people n is given. n is an integer satisfying 2 ≤ n ≤ 10 000. In the second line, incomes of n people are given. ai (1 ≤ i ≤ n) is the income of the i-th person. This value is an integer greater than or equal to 1 and less than or equal to 100 000.
The end of the input is indicated by a line containing a zero. The sum of n's of all the datasets does not exceed 50 000.
Output
For each dataset, output the number of people whose incomes are less than or equal to the average.
Sample Input
7
15 15 15 15 15 15 15
4
10 20 30 60
10
1 1 1 1 1 1 1 1 1 100
7
90 90 90 90 90 90 10
7
2 7 1 8 2 8 4
0
Output for the Sample Input
7
3
9
1
4
Problem B
Origami, or the art of folding paper
Master Grus is a famous origami (paper folding) artist, who is enthusiastic about exploring the possibility of origami art. For future creation, he is now planning fundamental experiments to establish the general theory of origami.
One rectangular piece of paper is used in each of his experiments. He folds it horizontally and/or vertically several times and then punches through holes in the folded paper.
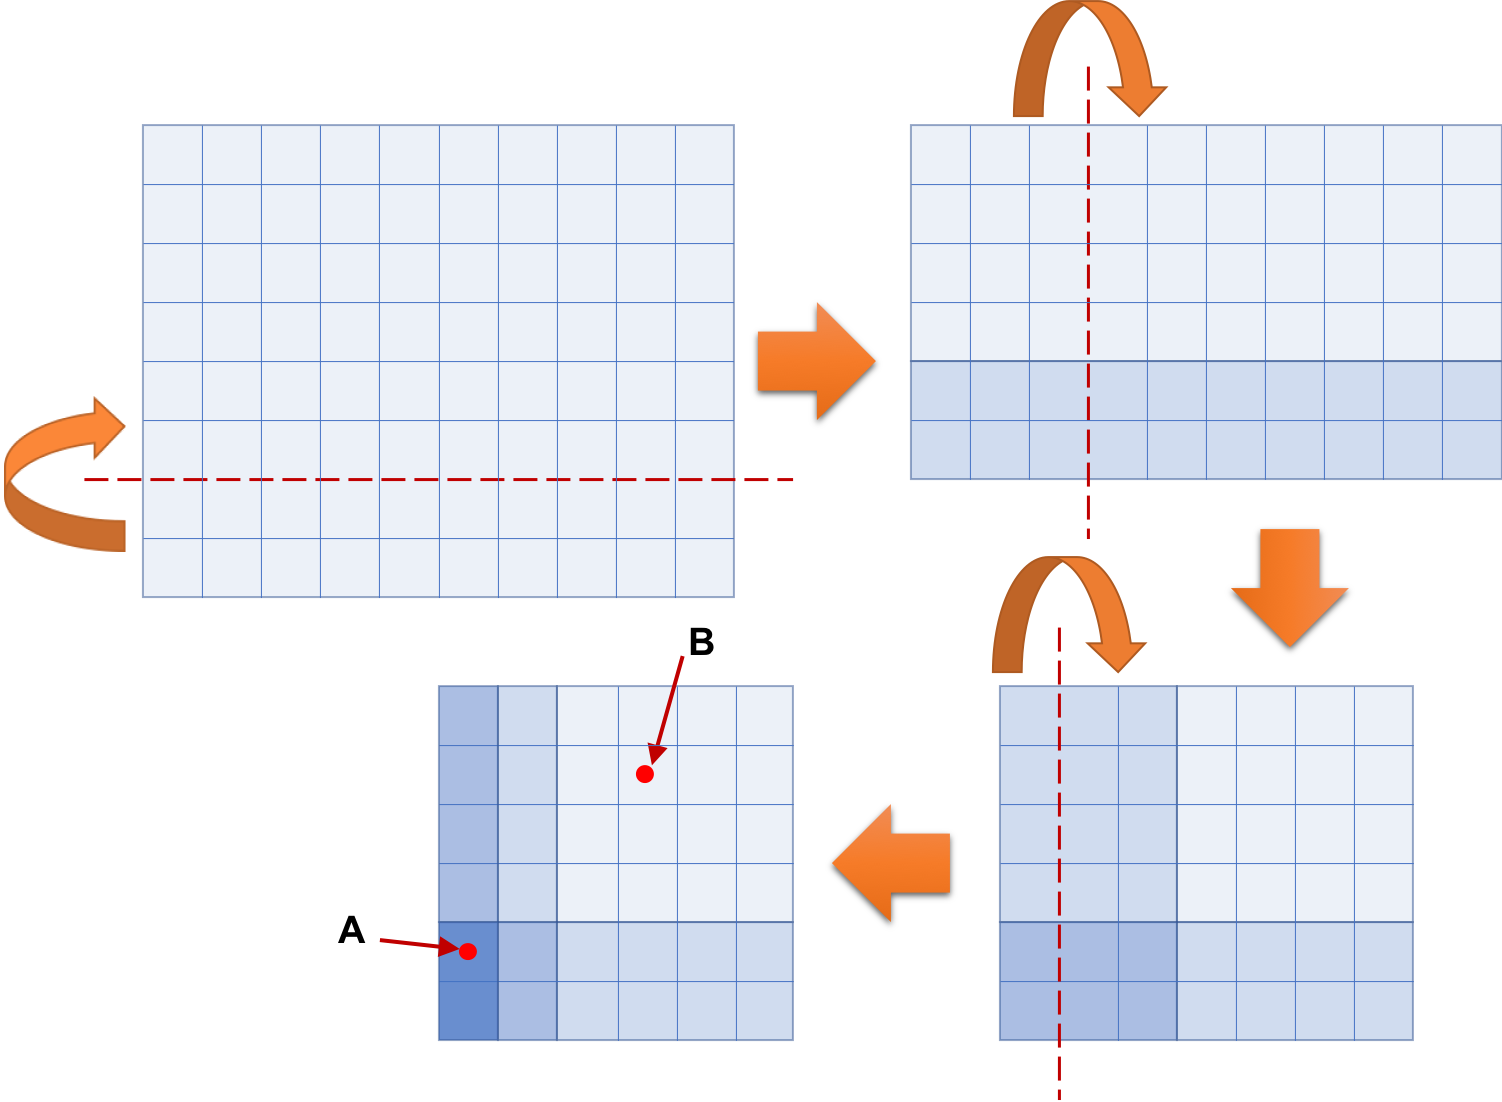
The following figure illustrates the folding process of a simple experiment, which corresponds to the third dataset of the Sample Input below. Folding the 10 × 8 rectangular piece of paper shown at top left three times results in the 6 × 6 square shape shown at bottom left. In the figure, dashed lines indicate the locations to fold the paper and round arrows indicate the directions of folding. Grid lines are shown as solid lines to tell the sizes of rectangular shapes and the exact locations of folding. Color densities represent the numbers of overlapping layers. Punching through holes at A and B in the folded paper makes nine holes in the paper, eight at A and another at B.
Your mission in this problem is to write a computer program to count the number of holes in the paper, given the information on a rectangular piece of paper and folding and punching instructions.
Input
The input consists of at most 1000 datasets, each in the following format.
n m t p
d1 c1
...
dt ct
x1 y1
...
xp yp
n and m are the width and the height, respectively, of a rectangular piece of paper. They are positive integers at most 32. t and p are the numbers of folding and punching instructions, respectively. They are positive integers at most 20. The pair of di and ci gives the i-th folding instruction as follows:
- di is either 1 or 2.
- ci is a positive integer.
- If di is 1, the left-hand side of the vertical folding line that passes at ci right to the left boundary is folded onto the right-hand side.
- If di is 2, the lower side of the horizontal folding line that passes at ci above the lower boundary is folded onto the upper side.
The end of the input is indicated by a line containing four zeros.
Output
For each dataset, output p lines, the i-th of which contains the number of holes punched in the paper by the i-th punching instruction.
Sample Input
2 1 1 1
1 1
0 0
1 3 2 1
2 1
2 1
0 0
10 8 3 2
2 2
1 3
1 1
0 1
3 4
3 3 3 2
1 2
2 1
1 1
0 1
0 0
0 0 0 0
Output for the Sample Input
2
3
8
1
3
6
Problem C
Skyscraper “MinatoHarukas ”
Mr. Port plans to start a new business renting one or more floors of the new skyscraper with one giga floors, MinatoHarukas. He wants to rent as many vertically adjacent floors as possible, because he wants to show advertisement on as many vertically adjacent windows as possible. The rent for one floor is proportional to the floor number, that is, the rent per month for the n-th floor is n times that of the first floor. Here, the ground floor is called the first floor in the American style, and basement floors are out of consideration for the renting. In order to help Mr. Port, you should write a program that computes the vertically adjacent floors satisfying his requirement and whose total rental cost per month is exactly equal to his budget.
For example, when his budget is 15 units, with one unit being the rent of the first floor, there are four possible rent plans, 1+2+3+4+5, 4+5+6, 7+8, and 15. For all of them, the sums are equal to 15. Of course in this example the rent of maximal number of the floors is that of 1+2+3+4+5, that is, the rent from the first floor to the fifth floor.
Input
The input consists of multiple datasets, each in the following format.
b
A dataset consists of one line, the budget of Mr. Port b as multiples of the rent of the first floor. b is a positive integer satisfying 1 < b < 109.
The end of the input is indicated by a line containing a zero. The number of datasets does not exceed 1000.
Output
For each dataset, output a single line containing two positive integers representing the plan with the maximal number of vertically adjacent floors with its rent price exactly equal to the budget of Mr. Port. The first should be the lowest floor number and the second should be the number of floors.
Sample Input
15
16
2
3
9699690
223092870
847288609
900660121
987698769
999999999
0
Output for the Sample Input
1 5
16 1
2 1
1 2
16 4389
129 20995
4112949 206
15006 30011
46887 17718
163837 5994
Problem D
Playoff by all the teams
The Minato Mirai Football Association hosts its annual championship as a single round-robin tournament, in which each team plays a single match against all the others. Unlike many other round-robin tournaments of football, matches never result in a draw in this tournament. When the regular time match is a tie, overtime is played, and, when it is a tie again, a penalty shootout is played to decide the winner.
If two or more teams won the most number of matches in the round-robin, a playoff is conducted among them to decide the champion. However, if the number of teams is an odd number, it is possible that all the teams may have the same number of wins and losses, in which case all the teams participate in the playoff, called a "full playoff" here.
Now, some of the tournament matches have already been played and we know their results. Whether or not a full playoff will be required may depend on the results of the remaining matches. Write a program that computes the number of win/loss combination patterns of the remaining matches that lead to a full playoff.
The first datatset of the Sample Input represents the results of the first three matches in a round-robin tournament of five teams, shown in the following table. In the table, gray cells indicate the matches not played yet.
 | Team1 | Team2 | Team3 | Team4 | Team5 |
|---|---|---|---|---|---|
| Team1 |  | lost | lost | ||
| Team2 | | lost | |||
| Team3 | won | | |||
| Team4 | won | | |||
| Team5 | won | |
In this case, all the teams win the same number of matches with only two win/loss combination patterns of the remaining matches, which lead to a full playoff, as shown below. In the two tables, the differences are indicated in light yellow.
| Team1 | Team2 | Team3 | Team4 | Team5 |
|---|---|---|---|---|---|
| Team1 | | won | won | lost | lost |
| Team2 | lost | | lost | won | won |
| Team3 | lost | won | | won | lost |
| Team4 | won | lost | lost | | won |
| Team5 | won | lost | won | lost | |
| Team1 | Team2 | Team3 | Team4 | Team5 |
|---|---|---|---|---|---|
| Team1 | | won | won | lost | lost |
| Team2 | lost | | lost | won | won |
| Team3 | lost | won | | lost | won |
| Team4 | won | lost | won | | lost |
| Team5 | won | lost | lost | won | |
Input
The input consists of multiple datasets, each in the following format.
n
m
x1 y1
...
xm ym
n is an odd integer, 3, 5, 7, or 9, indicating the number of teams participating in the tournament. m is a positive integer less than n(n−1)/2, which is the number of matches already finished. xi and yi give the result of the i-th match that has already taken place, indicating that team xi defeated team yi. Each of xi and yi is an integer 1 through n which indicates the team number. No team plays against itself, that is, for any i, xi ≠ yi. The match result of the same team pair appears at most once. That is, if i ≠ j, then (xi,yi) ≠ (xj,yj) and (xi,yi) ≠ (yj,xj) hold.
The end of the input is indicated by a line containing a zero. The number of datasets does not exceed 100.
Output
For each dataset, output a single line containing one integer which indicates the number of possible future win/loss patterns that a full playoff will be required.
Sample Input
5
3
3 2
4 1
5 1
3
1
1 2
3
2
1 2
3 2
5
4
4 1
4 2
5 1
5 2
5
3
4 1
4 2
5 1
5
4
3 2
4 1
5 1
5 2
9
11
6 1
6 4
7 2
7 3
7 4
8 2
8 3
8 4
9 1
9 3
9 5
9
10
6 1
6 4
7 2
7 3
7 4
8 2
8 3
8 4
9 1
9 3
5
6
4 3
2 1
5 1
2 4
1 3
2 3
9
1
1 2
0
Output for the Sample Input
2
1
0
0
1
0
0
16
0
1615040
Problem E
Floating-Point Numbers
In this problem, we consider floating-point number formats, data representation formats to approximate real numbers on computers.
Scientific notation is a method to express a number, frequently used for numbers too large or too small to be written tersely in usual decimal form. In scientific notation, all numbers are written in the form m × 10e. Here, m (called significand) is a number greater than or equal to 1 and less than 10, and e (called exponent) is an integer. For example, a number 13.5 is equal to 1.35×101, so we can express it in scientific notation with significand 1.35 and exponent 1.
As binary number representation is convenient on computers, let's consider binary scientific notation with base two, instead of ten. In binary scientific notation, all numbers are written in the form m × 2e. Since the base is two, m is limited to be less than 2. For example, 13.5 is equal to 1.6875×23, so we can express it in binary scientific notation with significand 1.6875 and exponent 3. The significand 1.6875 is equal to 1 + 1/2 + 1/8 + 1/16, which is 1.10112 in binary notation. Similarly, the exponent 3 can be expressed as 112 in binary notation.
A floating-point number expresses a number in binary scientific notation in finite number of bits. Although the accuracy of the significand and the range of the exponent are limited by the number of bits, we can express numbers in a wide range with reasonably high accuracy.
In this problem, we consider a 64-bit floating-point number format, simplified from one actually used widely, in which only those numbers greater than or equal to 1 can be expressed. Here, the first 12 bits are used for the exponent and the remaining 52 bits for the significand. Let's denote the 64 bits of a floating-point number by b64...b1. With e an unsigned binary integer (b64...b53)2, and with m a binary fraction represented by the remaining 52 bits plus one (1.b52...b1)2, the floating-point number represents the number m × 2e.
We show below the bit string of the representation of 13.5 in the format described above.
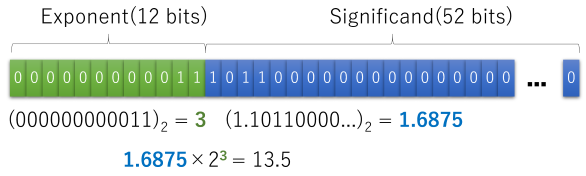
In floating-point addition operations, the results have to be approximated by numbers representable in floating-point format. Here, we assume that the approximation is by truncation. When the sum of two floating-point numbers a and b is expressed in binary scientific notation as a + b = m × 2e (1 ≤ m < 2, 0 ≤ e < 212), the result of addition operation on them will be a floating-point number with its first 12 bits representing e as an unsigned integer and the remaining 52 bits representing the first 52 bits of the binary fraction of m.
A disadvantage of this approximation method is that the approximation error accumulates easily. To verify this, let's make an experiment of adding a floating-point number many times, as in the pseudocode shown below. Here, s and a are floating-point numbers, and the results of individual addition are approximated as described above.
s := a
for n times {
    s := s + a
}
For a given floating-point number a and a number of repetitions n, compute the bits of the floating-point number s when the above pseudocode finishes.
Input
The input consists of at most 1000 datasets, each in the following format.
n
b52...b1
n is the number of repetitions. (1 ≤ n ≤ 1018) For each i, bi is either 0 or 1. As for the floating-point number a in the pseudocode, the exponent is 0 and the significand is b52...b1.
The end of the input is indicated by a line containing a zero.
Output
For each dataset, the 64 bits of the floating-point number s after finishing the pseudocode should be output as a sequence of 64 digits, each being 0 or 1 in one line.
Sample Input
1
0000000000000000000000000000000000000000000000000000
2
0000000000000000000000000000000000000000000000000000
3
0000000000000000000000000000000000000000000000000000
4
0000000000000000000000000000000000000000000000000000
7
1101000000000000000000000000000000000000000000000000
100
1100011010100001100111100101000111001001111100101011
123456789
1010101010101010101010101010101010101010101010101010
1000000000000000000
1111111111111111111111111111111111111111111111111111
0
Output for the Sample Input
0000000000010000000000000000000000000000000000000000000000000000
0000000000011000000000000000000000000000000000000000000000000000
0000000000100000000000000000000000000000000000000000000000000000
0000000000100100000000000000000000000000000000000000000000000000
0000000000111101000000000000000000000000000000000000000000000000
0000000001110110011010111011100001101110110010001001010101111111
0000000110111000100001110101011001000111100001010011110101011000
0000001101010000000000000000000000000000000000000000000000000000
Problem F
Equilateral Triangular Fence
Ms. Misumi owns an orchard along a straight road. Recently, wild boars have been witnessed strolling around the orchard aiming at pears, and she plans to construct a fence around many of the pear trees.
The orchard contains n pear trees, whose locations are given by the two-dimensional Euclidean coordinates (x1, y1),..., (xn, yn). For simplicity, we neglect the thickness of pear trees. Ms. Misumi's aesthetic tells that the fence has to form a equilateral triangle with one of its edges parallel to the road. Its opposite apex, of course, should be apart from the road. The coordinate system for the positions of the pear trees is chosen so that the road is expressed as y = 0, and the pear trees are located at y ≥ 1.
Due to budget constraints, Ms. Misumi decided to allow at most k trees to be left outside of the fence. You are to find the shortest possible perimeter of the fence on this condition.
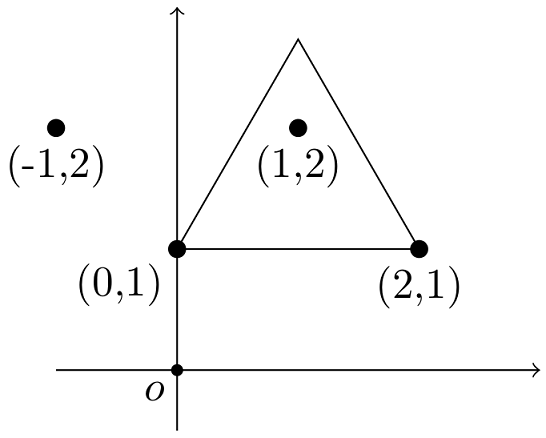
The following figure shows the first dataset of the Sample Input. There are four pear trees at (−1,2), (0,1), (1,2), and (2,1). By excluding (−1,2) from the fence, we obtain the equilateral triangle with perimeter 6.
Input
The input consists of multiple datasets, each in the following format.
n
k
x1 y1
...
xn yn
Each of the datasets consists of n+2 lines. n in the first line is the integer representing the number of pear trees; it satisfies 3 ≤ n ≤ 10 000. k in the second line is the integer representing the number of pear trees that may be left outside of the fence; it satisfies 1 ≤ k ≤ min(n−2, 5 000). The following n lines have two integers each representing the x- and y- coordinates, in this order, of the locations of pear trees; it satisfies −10 000 ≤ xi ≤ 10 000, 1 ≤ yi ≤ 10 000. No two pear trees are at the same location, i.e., (xi, yi)=(xj, yj) only if i=j.
The end of the input is indicated by a line containing a zero. The number of datasets is at most 100.
Output
For each dataset, output a single number that represents the shortest possible perimeter of the fence. The output must not contain an error greater than 10−6.
Sample Input
4
1
0 1
1 2
-1 2
2 1
4
1
1 1
2 2
1 3
1 4
4
1
1 1
2 2
3 1
4 1
4
1
1 2
2 1
3 2
4 2
5
2
0 1
0 2
0 3
0 4
0 5
6
3
0 2
2 2
1 1
0 3
2 3
1 4
0
Output for the Sample Input
6.000000000000
6.928203230276
6.000000000000
7.732050807569
6.928203230276
6.000000000000
Problem G
Expression Mining
Consider an arithmetic expression built by combining single-digit positive integers with addition symbols +, multiplication symbols *, and parentheses ( ), defined by the following grammar rules with the start symbol E.
  E ::= T | E '+' T
  T ::= F | T '*' F
  F ::= '1' | '2' | '3' | '4' | '5' | '6' | '7' | '8' | '9' | '(' E ')'
When such an arithmetic expression is viewed as a string, its substring, that is, a contiguous sequence of characters within the string, may again form an arithmetic expression. Given an integer n and a string s representing an arithmetic expression, let us count the number of its substrings that can be read as arithmetic expressions with values computed equal to n.
Input
The input consists of multiple datasets, each in the following format.
n
s
A dataset consists of two lines. In the first line, the target value n is given. n is an integer satisfying 1 ≤ n ≤ 109. The string s given in the second line is an arithmetic expression conforming to the grammar defined above. The length of s does not exceed 2×10⁶. The nesting depth of the parentheses in the string is at most 1000.
The end of the input is indicated by a line containing a single zero. The sum of the lengths of s in all the datasets does not exceed 5×10⁶.
Output
For each dataset, output in one line the number of substrings of s that conform to the above grammar and have the value n. The same sequence of characters appearing at different positions should be counted separately.
Sample Input
3
(1+2)*3+3
2
1*1*1+1*1*1
587
1*(2*3*4)+5+((6+7*8))*(9)
0
Output for the Sample Input
4
9
2
Problem H
For Programming Excellence
A countless number of skills are required to be an excellent programmer. Different skills have different importance degrees, and the total programming competence is measured by the sum of products of levels and importance degrees of his/her skills.
In this summer season, you are planning to attend a summer programming school. The school offers courses for many of such skills. Attending a course for a skill, your level of the skill will be improved in proportion to the tuition paid, one level per one yen of tuition, however, each skill has its upper limit of the level and spending more money will never improve the skill level further. Skills are not independent: For taking a course for a skill, except for the most basic course, you have to have at least a certain level of its prerequisite skill.
You want to realize the highest possible programming competence measure within your limited budget for tuition fees.
Input
The input consists of no more than 100 datasets, each in the following format.
n k
h1 ... hn
s1 ... sn
p2 ... pn
l2 ... ln
- The first line has two integers, n, the number of different skills between 2 and 100, inclusive, and k, the budget amount available between 1 and 105, inclusive. In what follows, skills are numbered 1 through n.
- The second line has n integers h1...hn, in which hi is the maximum level of the skill i, between 1 and 105, inclusive.
- The third line has n integers s1...sn, in which si is the importance degree of the skill i, between 1 and 109, inclusive.
- The fourth line has n−1 integers p2...pn, in which pi is the prerequisite skill of the skill i, between 1 and i−1, inclusive. The skill 1 has no prerequisites.
- The fifth line has n−1 integers l2...ln, in which li is the least level of prerequisite skill pi required to learn the skill i, between 1 and hpi , inclusive.
The end of the input is indicated by a line containing two zeros.
Output
For each dataset, output a single line containing one integer, which is the highest programming competence measure achievable, that is, the maximum sum of the products of levels and importance degrees of the skills, within the given tuition budget, starting with level zero for all the skills. You do not have to use up all the budget.
Sample Input
3 10
5 4 3
1 2 3
1 2
5 2
5 40
10 10 10 10 8
1 2 3 4 5
1 1 2 3
10 10 10 10
5 10
2 2 2 5 2
2 2 2 5 2
1 1 2 2
2 1 2 1
0 0
Output for the Sample Input
18
108
35